Visualisasi Uji Signifikansi Statistik Menggunakan GrADS
On this page
Postingan ini merupakan lanjutan dari postingan sebelumnya Uji Hipotesis Statistik: Penerapannya dalam Meteorologi/Klimatologi.
Script dibawah ini berguna untuk menampilkan variabel transpor uap air secara spasial yang telah mengalami uji signifikansi statistik.
Script GrADS
'reinit'

*Setting parea=========================================================
sxx=1; exx=11; ddxx=0; dxx=((exx-sxx)/5)-ddxx;
x1.1=sxx;      x2.1=x1.1+dxx; xr1=x1.1' 'x2.1
x1.2=x2.1+ddxx; x2.2=x1.2+dxx; xr2=x1.2' 'x2.2
x1.3=x2.2+ddxx; x2.3=x1.3+dxx; xr3=x1.3' 'x2.3
x1.4=x2.3+ddxx; x2.4=x1.4+dxx; xr4=x1.4' 'x2.4
x1.5=x2.4+ddxx; x2.5=x1.5+dxx; xr5=x1.5' 'x2.5
syy=7.8; eyy=1; ddyy=1.2; dyy=((syy-eyy)/2)-ddyy;
y2.1=syy;       y1.1=y2.1-dyy; yr1=y1.1' 'y2.1
y2.2=y1.1-ddyy; y1.2=y2.2-dyy; yr2=y1.2' 'y2.2
y2.3=y1.2-ddyy; y1.3=y2.3-dyy; yr3=y1.3' 'y2.3
y2.4=y1.3-ddyy; y1.4=y2.4-dyy; yr4=y1.4' 'y2.4
p.1.1=xr1' 'yr1; p.2.1=xr2' 'yr1; p.3.1=xr3' 'yr1; p.4.1=xr4' 'yr1; p.5.1=xr5' 'yr1;
p.1.2=xr1' 'yr2; p.2.2=xr2' 'yr2; p.3.2=xr3' 'yr2; p.4.2=xr4' 'yr2; p.5.2=xr5' 'yr2;
p.1.3=xr1' 'yr3; p.2.3=xr2' 'yr3; p.3.3=xr3' 'yr3; p.4.3=xr4' 'yr3; p.5.3=xr5' 'yr3;
p.1.4=xr1' 'yr4; p.2.4=xr2' 'yr4; p.3.4=xr3' 'yr4; p.4.4=xr4' 'yr4; p.5.4=xr5' 'yr4;


'sdfopen D:\Sem8\Skripsi\#1_OLAH\vis\#mb.nc'

timelag = '1 21'
timelaglab = '-10 10'
xlint = '10'; ylint = '5'
xycfg = '1 3 0.15'
cl = '-4 -2 0 2 4 6 8'

'set map 1 1 1'

label.1.1 = '(a)H-2 (CS)';
label.1.2 = '(b)H-1 (CS)'
label.1.3 = '(c)H_0 (CS)';
label.1.4 = '(d)H+1 (CS)'
label.1.5 = '(e)H+2 (CS)';
label.2.1 = '(f)H-2 (CENS)'
label.2.2 = '(g)H-1 (CENS)';
label.2.3 = '(h)H_0 (CENS)'
label.2.4 = '(g)H+1 (CENS)';
label.2.5 = '(h)H+2 (CENS)'

;*var.1.1 = 'vimfdcs';
;*var.1.2 = 'q1pcpcsmeanrb'
;*var.1.3 = 'q1pcpcsmeanrc';
;*var.1.4 = 'q1pcpcsmeanrd'
;*var.1.5 = 'q1pcpcsmeanrd'
;*var.2.1 = 'q2pcpcsmeanra';
;*var.2.2 = 'q2pcpcsmeanrb'
;*var.2.3 = 'q2pcpcsmeanrc';
;*var.2.4 = 'q2pcpcsmeanrd'
;*var.2.5 = 'q2pcpcsmeanrd'

day0 = 11
lag.1=-2; lags.1='0'
lag.2=-1; lags.2='+2'
lag.3=0; lags.3='+4'
lag.4=1
lag.5=2
len=0.5; vskip='10'; scale=700
tileopt = '0 0.05 -type 2 -int 5 -color 4'
colopt = '-0.0001 0.0001 -kind rainbow'
colopt = '-12 12 4 -kind lime->white->red'
xcbaropt = '0.5 6.8 1 1.2 -fs 1 -fh 0.18 -fw 0.15 -ft 5 -line on -edge triangle'

arrowloc='104 -26'
arrlabloc='105 -30'

ir = 1
while (ir<=2)
  ic = 1
  while (ic<=5)
    tt = day0+lag.ic
	say 'time 'tt
    'set parea 'p.ic.ir
    say 'parea 'p.ic.ir
    'set t 'tt
    'set grads off'
    'set grid off'
    'set timelab off'
    'set datawarn off'
    'set xlint 'xlint
    'set strsiz 0.15 0.18'
    'set string 1 l 5 0'
    'draw string 'x1.ic' 'y2.ir+0.2' 'label.ir.ic
    'set gxout shaded'
    'set csmooth on'
    'set xlopts 'xycfg; 'set ylopts 'xycfg

    if ir=1
    'define mags=iuqcspval+ivqcspval'; minvals=0.1
    if ic = 1
      'set ylint 'ylint
      'color 'colopt
      'd maskout(vimfdcsmean*100000,0.05-vimfdcspval)'
      'set gxout contour'
      'set ccolor 1'; 'set cthick 2'; 'set clab on';
      ;*'d vimfdcsmean*100000'
      'set gxout vector'; 'set ccolor 1'; 'set cthick 2';
      'set arrlab off'; 'set arrscl 'len' 'scale; 'set arrowhead 0.05'
      'd skip(iuqcsmean,'vskip');maskout(ivqcsmean,0.05-ivqcspval)'
      'draw xlab longitude'
      'draw ylab latitude'
	else
      'set ylab off'
      'color 'colopt
      'd maskout(vimfdcsmean*100000,0.05-vimfdcspval)'
      'set gxout contour'
      'set ccolor 1'; 'set cthick 2'; 'set clab on';
      ;*'d vimfdcsmean*100000'
      'set gxout vector'; 'set ccolor 1'; 'set cthick 2';
      'set arrlab off'; 'set arrscl 'len' 'scale; 'set arrowhead 0.05'
      'd skip(iuqcsmean,'vskip');maskout(ivqcsmean,0.05-ivqcspval)'
      'draw xlab longitude'
    endif
    endif


    if ir=2
    'define mags=iuqcenspval+ivqcenspval'; minvals=0.1
    if ic = 1
      'set ylint 'ylint
      'color 'colopt
      'd maskout(vimfdcensmean*100000,0.05-vimfdcenspval)'
      'set gxout contour'
      'set ccolor 1'; 'set cthick 2'; 'set clab on';
      ;*'d vimfdcsmean*100000'
      'set gxout vector'; 'set ccolor 1'; 'set cthick 2';
      'set arrlab off'; 'set arrscl 'len' 'scale; 'set arrowhead 0.05'
      'd skip(iuqcensmean,'vskip');maskout(ivqcensmean,0.05-ivqcenspval)'
      'draw xlab longitude'
      'draw ylab latitude'
	else
      'set ylab off'
      'color 'colopt
      'd maskout(vimfdcensmean*100000,0.05-vimfdcenspval)'
      'xcbar 'xcbaropt
      'set gxout contour'
      'set ccolor 1'; 'set cthick 2'; 'set clab on';
      ;*'d vimfdcsmean*100000'
      'set gxout vector'; 'set ccolor 1'; 'set cthick 2';
      'set arrlab off'; 'set arrscl 'len' 'scale; 'set arrowhead 0.05'
      'd skip(iuqcensmean,'vskip');maskout(ivqcensmean,0.05-ivqcenspval)'
      'draw xlab longitude'
    endif
    endif
    'set ylab on'

     if ir=2
       if ic=5
         'q w2xy 'arrlabloc; lin=sublin(result,1);  xa=subwrd(lin,3); ya=subwrd(lin,6)
         'set string 1 l 5 0'; 'set strsiz 0.15 0.18'
         'draw string 'xa' 'ya' kg`30`0m`a-1`n`30`0s`a-1`n'
         'q w2xy 'arrowloc
         lin=sublin(result,1);  xa=subwrd(lin,3); ya=subwrd(lin,6)
         rc = arrow(xa-0.25,ya,len,scale)
       endif
     endif

    ic = ic+1
  endwhile

  ir = ir+1
endwhile
'set strsiz 0.18 0.2'
'set string 1 l 5 0'
'draw string 6.8 0.9 `3*`010`a-5`nkg`30`0m`a-2`n`30`0s`a-1`n'

'printim D:\vimfd.svg white'


function arrow(x,y,len,scale)
'set line 1 1 3'
'draw line 'x-len/2.' 'y' 'x+len/2.' 'y
'draw line 'x+len/2.-0.05' 'y+0.05' 'x+len/2.' 'y
'draw line 'x+len/2.-0.05' 'y-0.05' 'x+len/2.' 'y
'set string 1 c 5'
'set strsiz 0.15 0.18'
'draw string 'x' 'y-0.25' 'scale
return
Output
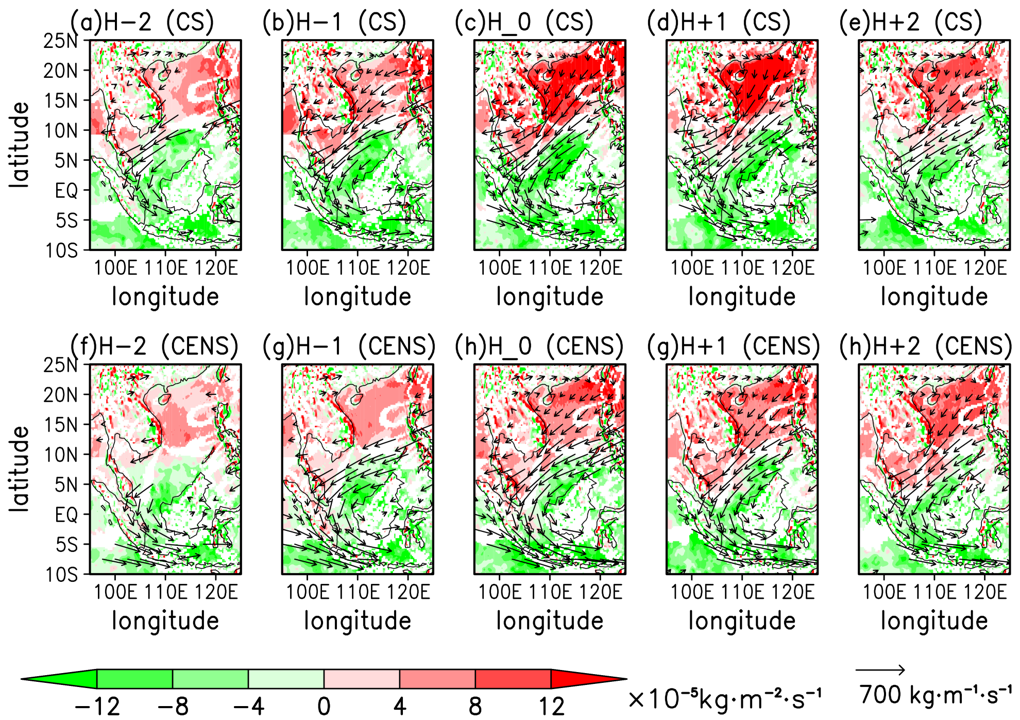
Transpor uap air berikut dengan divergensinya pada kasus cold surge (CS) dan cross equatorial northerly surge (CENS). Nilai positif (negatif) menandakan divergensi (konvergensi) dari transpor uap air.
Comments